Sonnenstunden · Jahresreihe
Sonnenstunden nach Jahr: Deutschland seit 1951
Die Jahressumme der Sonnenscheindauer als Flächenmittel der DWD-Rasterdaten für jedes Jahr von 1951 bis 2025. Rekordjahr 2022 mit 2.024 Stunden, trübstes Jahr 1977 mit 1.362. Jede Jahresseite zeigt zusätzlich die Bundesländer und die sonnigsten Orte des Jahres.
Verlauf 1951 bis 2025
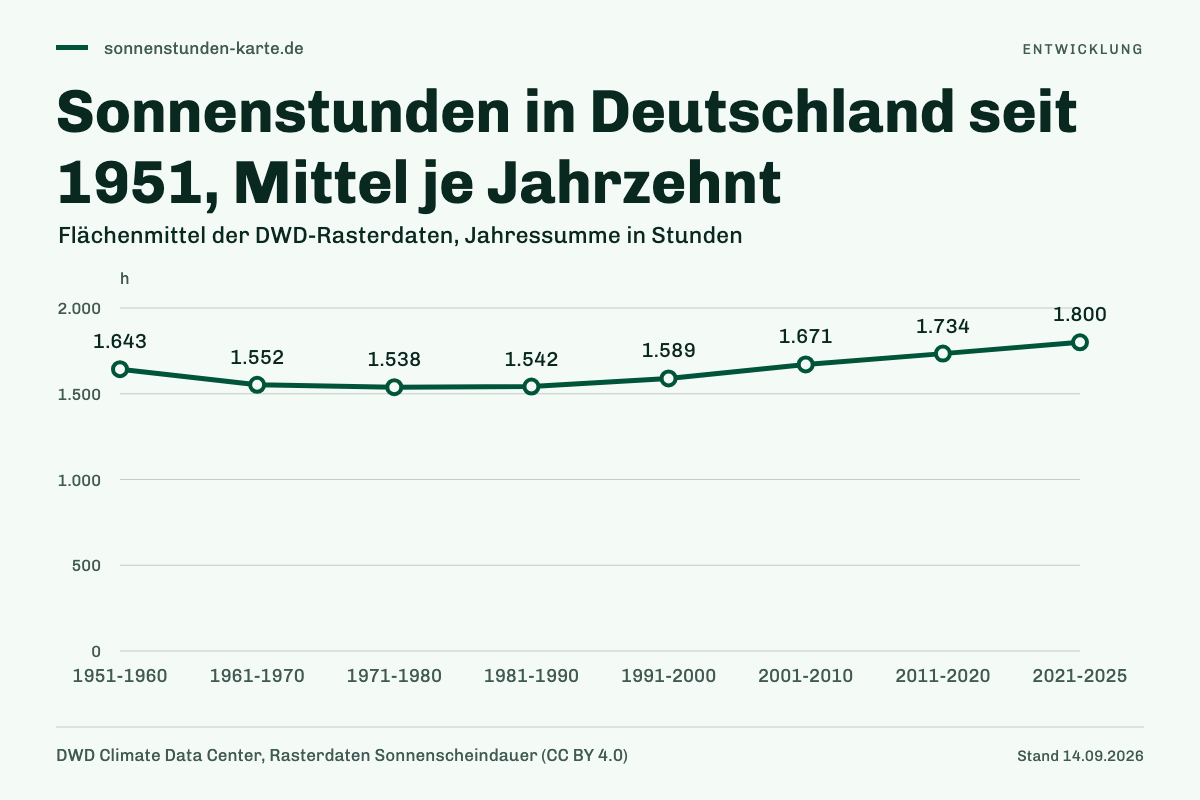
Jahrzehnte im Vergleich
| Jahrzehnt | Sonne (h/Jahr) | Abstand zu 1991-2020 |
|---|---|---|
| 1951-1960 | 1.643 | −22 h |
| 1961-1970 | 1.552 | −112 h |
| 1971-1980 | 1.538 | −127 h |
| 1981-1990 | 1.542 | −123 h |
| 1991-2000 | 1.589 | −76 h |
| 2001-2010 | 1.671 | +6 h |
| 2011-2020 | 1.734 | +69 h |
| 2021-2025 | 1.800 | +135 h |
Alle Jahre
Rang 1 ist das sonnigste Jahr
| Jahr | Sonne (h) | Abstand | Rang |
|---|---|---|---|
| 2025 | 1.914 | +249 h | 5 |
| 2024 | 1.675 | +11 h | 25 |
| 2023 | 1.753 | +88 h | 12 |
| 2022 | 2.024 | +359 h | 1 |
| 2021 | 1.631 | −34 h | 33 |
| 2020 | 1.896 | +231 h | 6 |
| 2019 | 1.834 | +169 h | 8 |
| 2018 | 2.015 | +351 h | 2 |
| 2017 | 1.596 | −69 h | 41 |
| 2016 | 1.607 | −58 h | 39 |
| 2015 | 1.743 | +78 h | 13 |
| 2014 | 1.621 | −44 h | 36 |
| 2013 | 1.508 | −157 h | 60 |
| 2012 | 1.674 | +9 h | 26 |
| 2011 | 1.847 | +182 h | 7 |
| 2010 | 1.537 | −128 h | 53 |
| 2009 | 1.686 | +21 h | 22 |
| 2008 | 1.635 | −30 h | 31 |
| 2007 | 1.692 | +27 h | 21 |
| 2006 | 1.772 | +107 h | 10 |
| 2005 | 1.743 | +78 h | 14 |
| 2004 | 1.590 | −75 h | 42 |
| 2003 | 2.011 | +346 h | 3 |
| 2002 | 1.533 | −131 h | 54 |
| 2001 | 1.514 | −151 h | 59 |
| 2000 | 1.546 | −119 h | 50 |
| 1999 | 1.626 | −39 h | 34 |
| 1998 | 1.438 | −227 h | 69 |
| 1997 | 1.722 | +57 h | 16 |
| 1996 | 1.504 | −161 h | 61 |
| 1995 | 1.601 | −64 h | 40 |
| 1994 | 1.612 | −53 h | 37 |
| 1993 | 1.539 | −126 h | 52 |
| 1992 | 1.623 | −41 h | 35 |
| 1991 | 1.679 | +14 h | 23 |
| 1990 | 1.692 | +27 h | 20 |
| 1989 | 1.732 | +67 h | 15 |
| 1988 | 1.451 | −214 h | 66 |
| 1987 | 1.371 | −294 h | 74 |
| 1986 | 1.555 | −110 h | 49 |
| 1985 | 1.522 | −143 h | 58 |
| 1984 | 1.401 | −264 h | 71 |
| 1983 | 1.583 | −82 h | 43 |
| 1982 | 1.719 | +54 h | 17 |
| 1981 | 1.392 | −273 h | 72 |
| 1980 | 1.444 | −221 h | 68 |
| 1979 | 1.447 | −218 h | 67 |
| 1978 | 1.383 | −282 h | 73 |
| 1977 | 1.362 | −303 h | 75 |
| 1976 | 1.754 | +89 h | 11 |
| 1975 | 1.657 | −8 h | 27 |
| 1974 | 1.452 | −212 h | 65 |
| 1973 | 1.643 | −22 h | 28 |
| 1972 | 1.533 | −132 h | 55 |
| 1971 | 1.706 | +41 h | 19 |
| 1970 | 1.481 | −184 h | 63 |
| 1969 | 1.570 | −94 h | 45 |
| 1968 | 1.543 | −122 h | 51 |
| 1967 | 1.635 | −30 h | 30 |
| 1966 | 1.437 | −228 h | 70 |
| 1965 | 1.454 | −211 h | 64 |
| 1964 | 1.676 | +11 h | 24 |
| 1963 | 1.609 | −56 h | 38 |
| 1962 | 1.558 | −107 h | 48 |
| 1961 | 1.562 | −103 h | 46 |
| 1960 | 1.482 | −183 h | 62 |
| 1959 | 1.984 | +319 h | 4 |
| 1958 | 1.526 | −139 h | 57 |
| 1957 | 1.639 | −26 h | 29 |
| 1956 | 1.528 | −136 h | 56 |
| 1955 | 1.634 | −31 h | 32 |
| 1954 | 1.560 | −104 h | 47 |
| 1953 | 1.784 | +119 h | 9 |
| 1952 | 1.577 | −88 h | 44 |
| 1951 | 1.712 | +47 h | 18 |
Häufige Fragen
Welches Jahr war das sonnigste in Deutschland?
2022 mit 2.024 Stunden im Flächenmittel, gefolgt von 2018 (2.015 h) und 2003 (2.011 h). Das trübste Jahr der Reihe war 1977 mit 1.362 Stunden.
Nimmt die Sonnenscheindauer in Deutschland zu?
Ja. Das Mittel der Jahre 1961-1990 lag bei 1.536 Stunden, das Mittel 1991-2020 bei 1.665; das Jahrzehnt 2011-2020 kam auf 1.734 Stunden und 2021-2025 auf 1.800. Einzelne Jahre schwanken um mehr als 500 Stunden.